


Dashboard start page
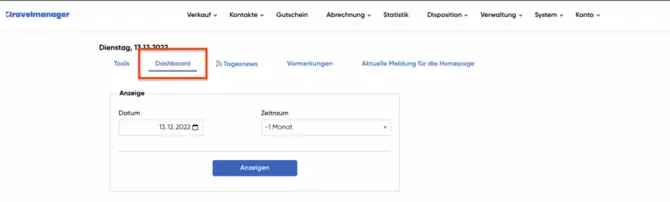
Always keep an eye on your sales. You will find the "Dashboard" tab in the backend on the start page, which is only displayed for admins and with the appropriate authorization in the user rights. Here you can select the relevant period and receive various diagrams that give you an overview of your sales.
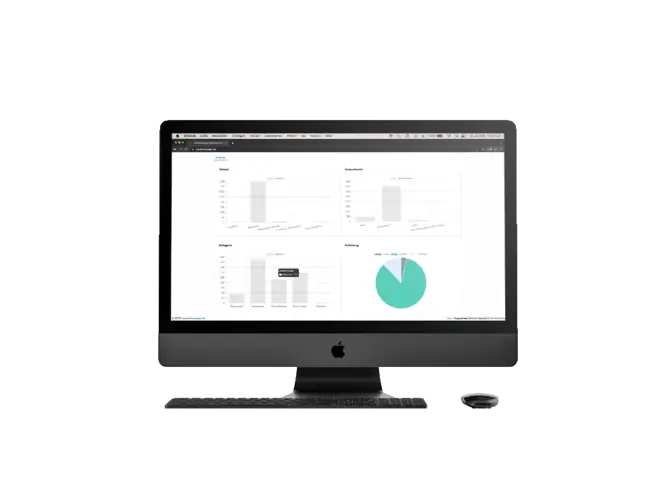
You can view the following diagrams in the dashboard:
- Pillar chart 1: Sales breakdown by different payment types.
- Pillar chart 2: Sales distribution to the different points of sale.
- Pillar chart 3: Sales breakdown by line types and individual sales.
- Circle diagram: Sales distribution across the different sales channels (Backend, Online Booking and Ticketapp).
The period you select takes the invoice date into account.